For months following her Left Ventricular Assist Device (LVAD) implant, life for my 80-year-old Mom had found a new, stable rhythm. Supported by the HeartMate 3, she was navigating her new normal with strength and grace.
Then, the alarms started.
They didn’t happen during the day, when she was active, but in the quiet of the night. A series of disruptive, low-flow alarms from the LVAD controller, beeping insistently for a problem she couldn’t feel. She was asymptomatic -no dizziness, no shortness of breath, no signs of trouble. Yet the machine, her lifeline, was signaling a persistent problem that defied simple explanations.
For our family, the sound was particularly chilling. This was the second time we had battled a wave of low-flow alarms. The first, shortly after she came home from her initial surgery, had been caused by a life-threatening pump thrombosis – a blood clot. That experience had taught us a hard lesson: a low flow alarm, even without symptoms, must be taken with the utmost seriousness.
This began a month-long journey into the complex world of LVAD data. This is a guide to understanding those alarms, questioning the easy assumptions, and ultimately, finding your flow- that state of stable, quiet operation that brings peace of mind. Because a low flow alarm is a symptom, not a diagnosis, and the key to effective LVAD management is learning to understand what that symptom is trying to tell you.
Understanding Your Toolkit – The LVAD Controller
Before you can investigate a problem, you need to understand the tools and data available to you. Your LVAD controller is a powerful diagnostic dashboard, and learning to read it is the first step to becoming an effective advocate.
Reading the Controller:
- Normal Operation: Your Four Key Gauges During normal, quiet operation, your controller screen displays four key numbers. It’s a great habit to log these numbers once a day to establish a personal “baseline” for your loved one. These numbers are Flow, Speed, Power, and PI (Pulsatility Index).
- The Anatomy of an Alarm When an alarm sounds, the controller uses colors and messages to tell you how serious the situation is.
- Advisory Alarms (Yellow Light): A yellow light with a message like “LOW FLOW” is a medium-priority warning. This is a prompt to investigate a temporary issue, like the patient’s position.
- Hazard Alarms (Red Light): A red light with a message like “LOW FLOW – Call Hospital” is a critical alarm. The official guide confirms this triggers when flow drops below a specific threshold, such as less than 2.5 L/min for the HeartMate 3. This requires an immediate call to your VAD coordinator.
- Accessing the Alarm History Your controller stores a history of past alarms. By navigating the menu, you can see a log of the date, time, and specific alarm code for each event. This is your first and most powerful tool for discovering patterns -for example, you might see that all the alarms are happening between 2 AM and 4 AM.
The LVAD’s Brain: How It Senses and Calculates Flow
The HeartMate 3 uses a complex, proprietary algorithm to estimate blood flow; it is not a simple, publicly available equation. This algorithm relies on a detailed pump performance map pre-programmed into the controller’s memory. The controller uses three key inputs to find its location on this internal map and provide an accurate flow estimate:
Hematocrit (HCT) Setting: This is the manually programmed value that tells the algorithm how thick or thin the blood is (viscosity). Since thicker blood requires more power to move, this setting is crucial for calibrating the flow estimate accurately.
Pump Speed (RPM): This is the fixed revolutions per minute set by the clinical team. It’s the baseline instruction telling the motor how fast to spin.
Pump Power (Watts): This is the amount of electrical energy the pump is actively using to maintain its set speed. An increase in power consumption means the pump is working harder to move blood, suggesting higher resistance (afterload) or a developing issue like a clot.
The Hematocrit Setting: A Vital Recalibration Tool
Since the HCT is a manual setting, its only purpose is to keep the pump’s estimate accurate by making sure it matches reality.
Think of it like a treadmill. You have to enter your body weight to get an accurate calories burned estimate. If you lose 20 pounds but never update your weight on the treadmill, its calorie estimate will be wrong. The HCT setting is the same; it must be updated to match the patient’s actual blood work to ensure the flow estimate is as close to reality as possible.
Interactive Tool: How the HCT Setting Affects Estimated Flow
As we’ve discussed, the Hematocrit (HCT) is a manual setting that tells the pump the assumed thickness of the blood. Because this number is programmed -not sensed. It has a direct impact on the pump’s calculated flow rate. The interactive chart below lets you see this effect in action.
The blue line represents a series of real low flow alarms that were recorded over several nights.
The dotted line represents the general alarm threshold of 2.5 L/min. While the controller’s internal algorithm is complex and can trigger alarms at slightly different values, this line serves as a useful visual guide for when an alarm is likely.
Use the slider to adjust the HCT setting from its original value and watch what happens to the blue line and the “Alarms Active” status. This demonstrates how changing this single input can alter the data you see on your screen.
Building Your At-Home Data Lab
You have the power to create a high-resolution snapshot for your medical team. Treating the problem like a data analyst is the single most effective way to get answers.
Create a Central Logbook
Your first and most powerful tool is a reliable log. Below are the key data points to track. **Roll over each item** to learn why it’s a critical clue and see a real-world logbook example.
Log During Each Alarm Event:
Track Daily for Overall Health:
Real-World Logbook Example
| Timestamp | Flow | Power | PI | MAP | HR | SpO2 | ODI | Weight | Temp | INR | Notes |
|---|---|---|---|---|---|---|---|---|---|---|---|
| 8/4/25 2:17:30 | 2.1 | 3.1 | 11.2 | 88 | 95 | 89% | 38 | 125.9 | 98.1 | 2.8 | Paused breathing on audio |
| 8/19/25 (Daily) | 4.1 | 3.4 | 7.6 | 82 | 80 | 96% | 10 | 125.5 | 97.9 | 2.9 | No alarms, slept on side |
Capture the Audio Evidence: What Happened Before the Alarm?
For nighttime alarms, an audio recording is your best tool for context. Use a sleep tracking app like Sleep as Android. Place the phone by the bedside and let it record the entire night. By syncing the time of an alarm from your Google Sheet with the audio file, you can hear what was happening in the seconds leading up to it- snoring, a sudden gasp, or a period of complete silence (apnea).
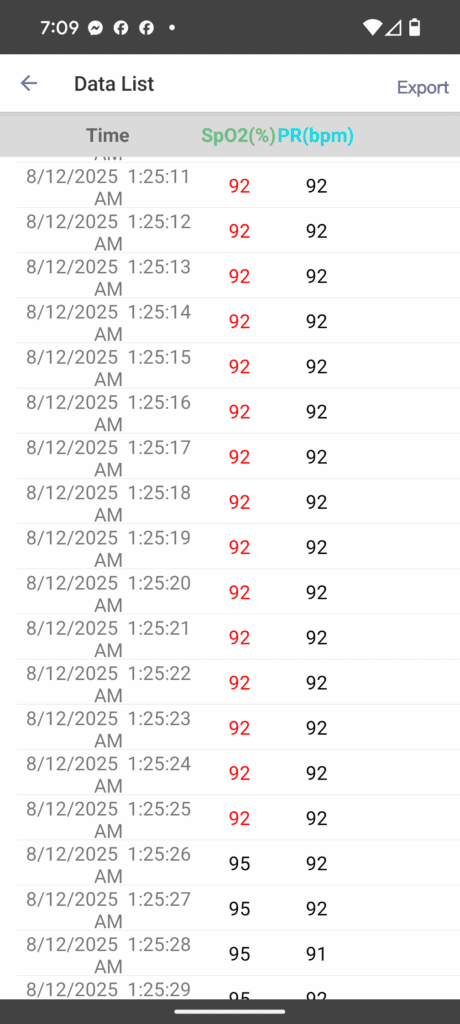
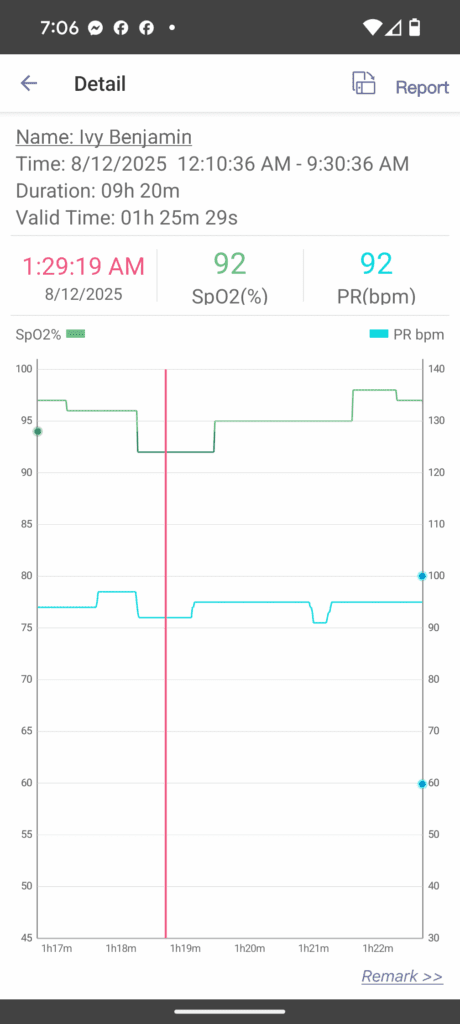
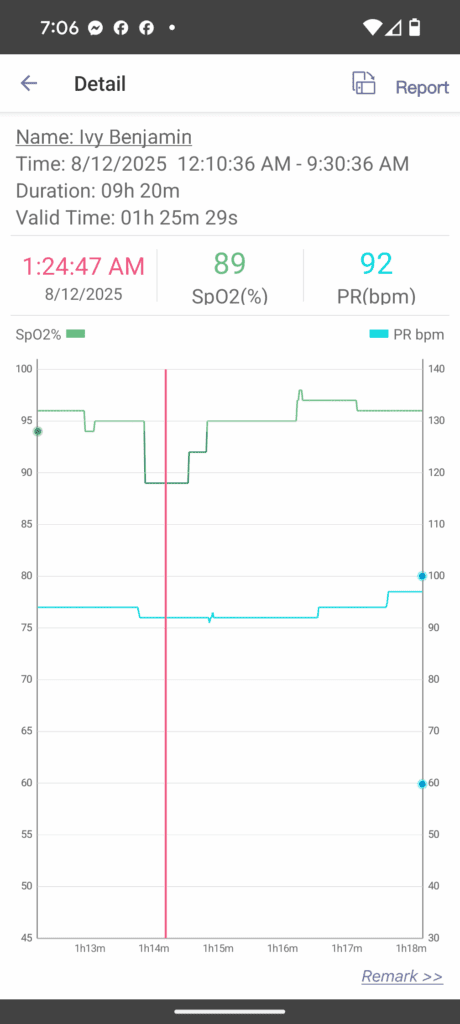
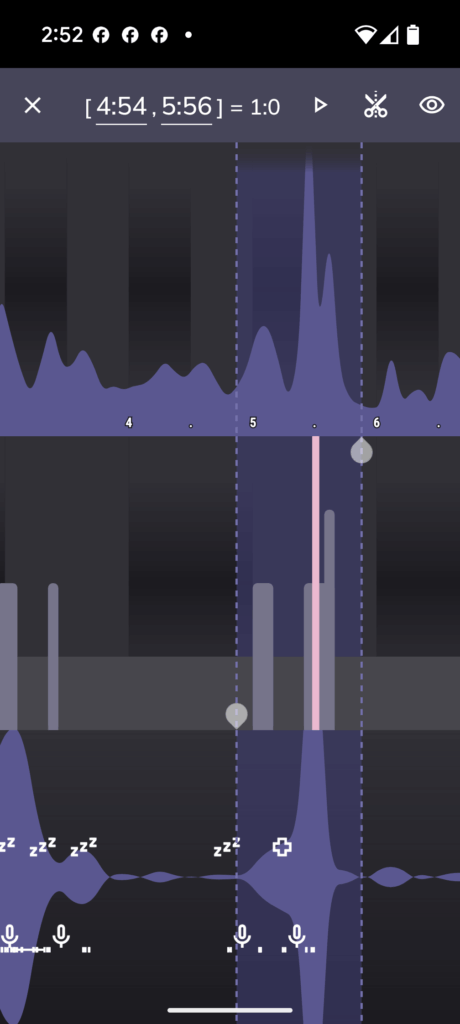
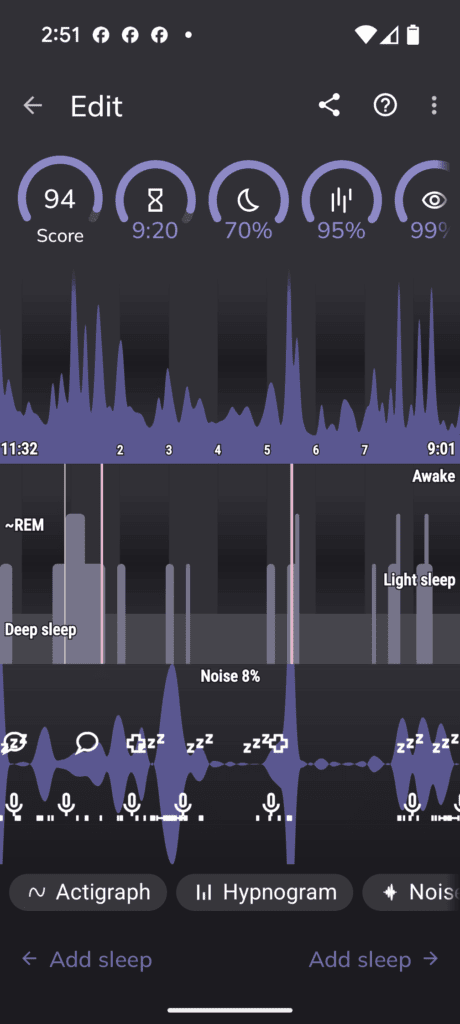
Think of yourself as a sound detective looking for a very specific pattern of evidence.
Step 1: Establish the Baseline
First, listen to a period when things are calm and there are no alarms. What does normal, rhythmic breathing sound like? It might be quiet, or it might involve some light, steady snoring. This is your “baseline.” You need to know what normal sounds like so you can identify the abnormal.
Step 2: Listen for the Three Key “Clues”
An obstructive sleep apnea event isn’t just one sound; it’s a distinct three-part sequence. When you review an audio file around the time of an alarm, you are listening for this specific pattern.
Clue #1: The Sound of Obstruction (Strained or Escalating Snoring)
Snoring itself is the sound of air struggling to get past a partially blocked airway. What you’re listening for isn’t just any snoring, but snoring that sounds strained or gets progressively louder (a crescendo). This is a sign that the airway is narrowing more and more, and the body is working harder to pull air through it. I definately heard this in the recordings. The majority of it was a predictable tempo and rhythm.
Clue #2: The Sound of Silence (The Apneic Pause)
This is the most critical piece of evidence. The loud snoring will suddenly stop, followed by a period of eerie silence. I observed this in multiple recording snippets. I can’t tell if this is like a lingering exhale waiting to inhale, or if it is a blocked airway. But it’s a definative break in the breathing/snoring pattern for up to 20 sec.
- What it is: This is not peaceful silence. This is the moment the airway has collapsed completely. No air is moving in or out. This is a full obstructive apnea.
- What to do: Time it. Use your phone’s stopwatch or the timer on the audio file. A pause lasting 10 seconds or longer is clinically significant. You might find pauses lasting 20, 30, or even more seconds.
Clue #3: The Sound of Recovery (The Gasp or Snort)
The silence is broken by an abrupt, often loud, and sometimes violent sound. I observed this, it’s sot a gasp, but a very loud nasaly snore.
- What it is: This is the body’s emergency override. The brain, starved of oxygen and flooded with CO₂, panics and sends a massive signal to force the airway open and take a breath. This is the moment that often causes the big surge in blood pressure and stress hormones.
- What it sounds like: It can be a loud gasp, a choke, a snort, or a body-jerking deep breath.
Putting It All Together: Reading the Full Sequence
When you sync your alarm log and SpO2, HR, with the audio recording, you can diagnose the event. Go to the timestamp of a low-flow alarm and rewind the audio by about 60 seconds.
The complete, incriminating sequence you are listening for is:
- Breathing or rhythmic snoring…
- …which becomes louder and more strained…
- …followed by abrupt silence (the apnea, which you can time)…
- …which is broken by a loud gasp, choke, or snort as breathing restarts. This corresponds to the lowest point of the SpO2 drop.
- A few seconds later, you hear the beep of the LVAD alarm on the recording.
If you can identify that exact….. Snore – Silence – Gasp – Alarm pattern, you have captured undeniable audio evidence of a positional obstructive sleep apnea event causing your low-flow alarm.
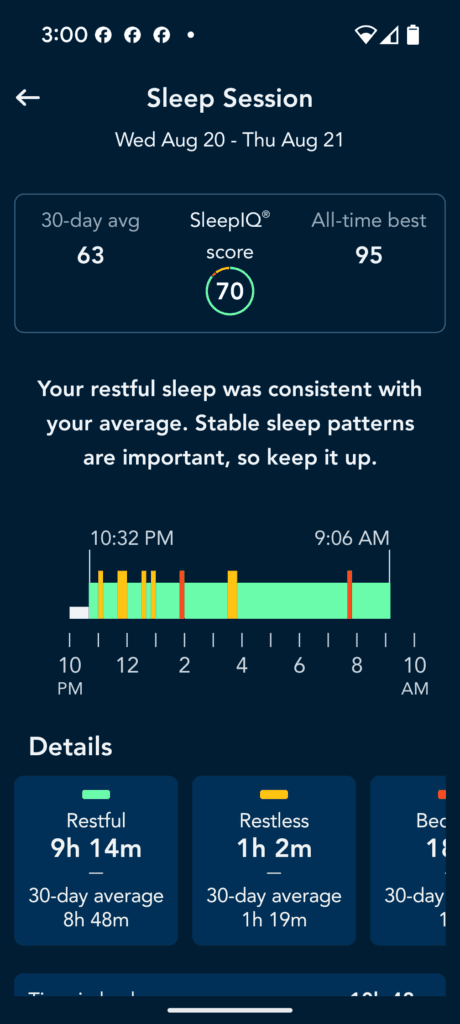
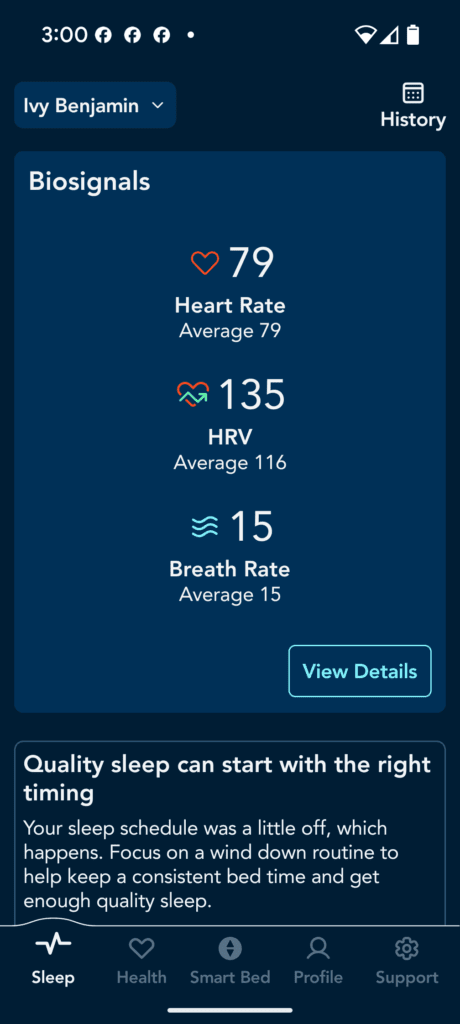
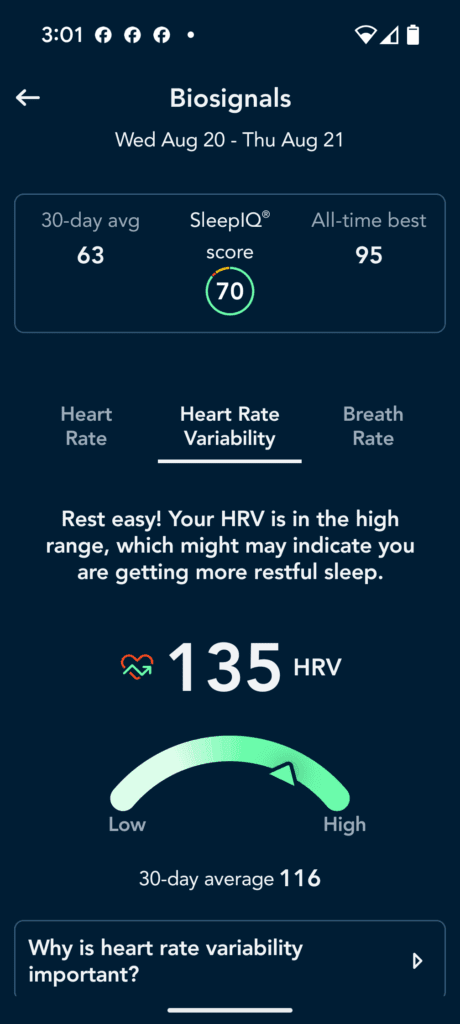
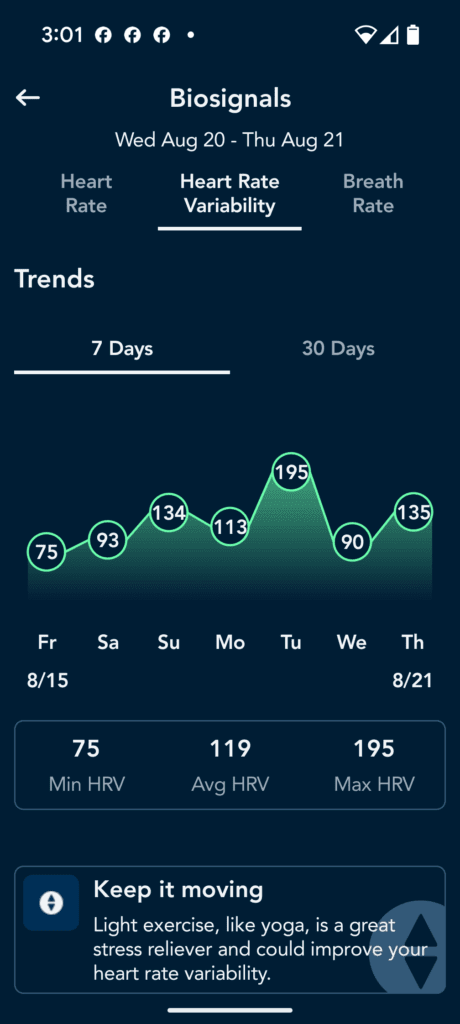
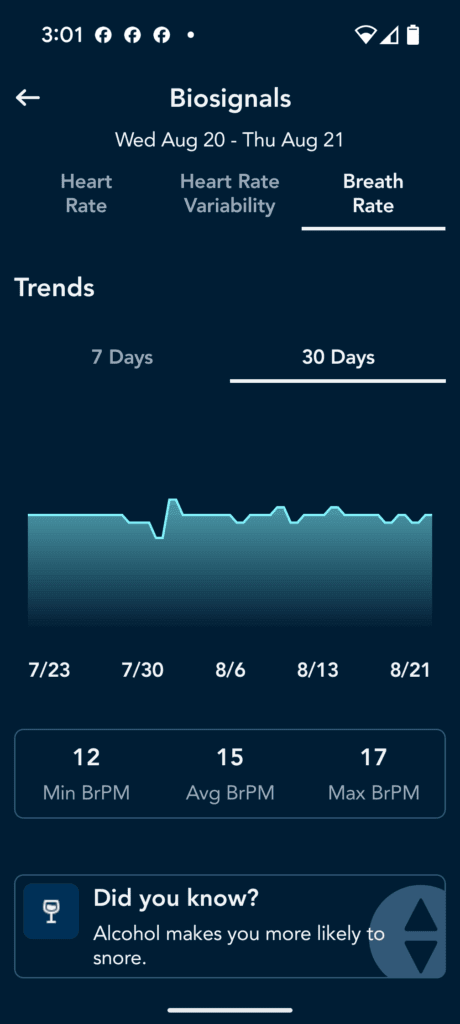
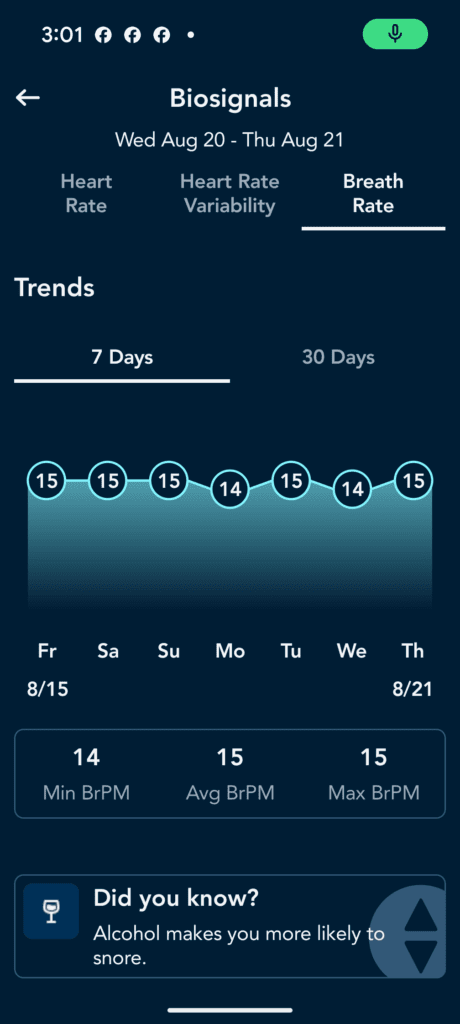
Sleep number, Breathe IQ- try it all out and see what metrics you can actually get and are reliable. For my mom’s Sleep Number bed, I looked at the HRV and breathing respirations and did see a corralation with the sleep as Android App data. but the data is not raw, so it’s diffifult to build a relationship between low flow incidents and HRV and respirations. BreatheIQ is a new addon, but you may have a smartwatch, or something else. You can’t improve what you cannot measure. So try it all and see what works. I’m using Sleep as Android for our sleep study though. There are too many to go into detail with each one. I’m just letting you know to try out different things that are available to you.
I will test rings and watches later but on watchs, even the Apple watch, your profusion index will be too low for any watch to work dependably. you could try to see if you correlate. Here are some screenshots from SleepIQ- cool app but no export features.
Add the Physiological Data
A logging pulse oximeter can provide the final, crucial layer of objective data.
While there are excellent, FDA-approved brands like Masimo and Nonin known for their accuracy with weak pulses, their models can be very expensive ($300-$500+) and base models often do not have continuous overnight recording needed for this kind of investigation.
We chose an EMAY logging pulse oximeter because it was an affordable and accurate tool for gathering this data. The feature I wwas most curious about was the Perfusion Index (PI), which measures the strength of the pulse at the sensor. This is different than the LVAD’s Pulsatility Index and is invaluable for reliably tracking a weak pulse. It can also be used by the software to calculate PVI.
While the device was highly consistent, we soon discovered its most powerful feature was its occasional failure. When an oximeter that normally works flawlessly suddenly struggles to find a pulse and SpO2, that isn’t a technical error -it’s a clinical sign. We learned that this event was often a precursor to a problem like hypovolemia (dehydration), serving as an early warning that trouble was on the way.
- A Good Starting Point: The clip-style EMAY Sleep Oxygen Monitor accurately logs continuous SpO2 and heart rate. Its app allows you to export this raw data and can even calculate your Oxygen Desaturation Index (ODI), a key metric showing how many times per hour your oxygen levels drop. The main downside is that the clip can become uncomfortable overnight.
- A More Powerful Solution: The wrist-worn EMAY SleepO2 Pro is more comfortable and adds a nasal tube to track airflow. This is a game-changer because its PC software uses this data to calculate your Apnea-Hypopnea Index (AHI) -the exact metric used to formally diagnose sleep apnea. It allows you to generate a detailed sleep report you can share directly with your doctors.
By combining the alarm data from your Google Sheet, the audio recording from your sleep app, and the SpO2/ODI/AHI data from your oximeter, you can build an undeniable, evidence-based case for what is happening when everyone else is asleep.
Sync Your Timelines and Build Your Case
Once you have gathered data from your logbook, audio recorder, and oximeter, the final step is to bring them together. This is how you transform separate streams of information into a single, undeniable piece of evidence.
Think of it like a detective syncing up different pieces of evidence to solve a case. The goal is to create a second-by-second timeline of what happens during an alarm event.
- Start with the Alarm Time: Open your Google Sheet and find the exact timestamp of a low flow alarm. For example: 2:17:30 AM. This is your anchor point.
- Find the Audio Cue: Go to your Sleep as Android audio recording and scrub to that exact time. Listen to the 30-60 seconds before the alarm. Do you hear snoring that suddenly stops? A period of silence? A gasp for air?
- Find the Physiological Proof: Open the data file from your EMAY oximeter. Go to the same timestamp. Do you see a sharp dip in the SpO2 graph that corresponds with the pause in breathing you heard? Do you see a drop in airflow if you’re using the Pro model?
By layering these three pieces of data together, you can confidently say:
At 2:17 AM, patient stopped breathing for 30 seconds, which caused her oxygen level to drop from 95% to 88%. This event triggered an LVAD low flow alarm at 2:17:30 AM.
You are no longer reporting a random alarm. You are presenting a complete diagnostic finding with a clear cause and effect. This is the data that builds an irrefutable case and empowers you to advocate effectively for the right treatment.
Flow Insights: Your Interactive Troubleshooter
Now that you’re familiar with the common alarm fingerprints, you can use this interactive tool to see them in action. This is your digital field guide. Use the filters to select the LVAD parameters you are seeing on your controller and search for any symptoms you’re observing. The tool will help you narrow down the potential causes, allowing you to build a data-driven hypothesis for what’s happening. Take a look at your log and get nighttime baseline average readings so you can calculate whats low, normal and high in your case.
Flow Finder 3000
Power
PI
Symptom Search
Clinical Flow Details
Select a card above to view its specific notes and action plan.
What Worked for Us
Our journey began with a frustrating mystery. My mom was experiencing persistent low flow alarms every night, yet she felt fine. After a hospital stay ruled out a pump clot or obstruction, the only solution offered was a change to her HCT setting. This software fix silenced the alarms for two days before they returned, confirming our fear that a real, underlying problem was being ignored. We were at a dead end with the standard approach, so we decided to conduct our own investigation.
The At-Home Investigation in Action
Using the framework from above, we built our own data lab. We logged every alarm in a Google Sheet. We used the Sleep as Android app to get a timestamped audio recording of each night. And we used the EMAY oximeter to get a continuous record of her SpO2 and heart rate.
The breakthrough came when we sat down at the computer and synced these three timelines. We pulled up three windows: the alarm log from our Google Sheet, the audio waveform from the sleep app, and the SpO2 graph from the oximeter. At 2:17 AM on the first night of data collection, we saw it all align perfectly:
- The audio recording showed a clear pause in her breathing. It also recorded the actual LVAD alarm sound.
- The oximeter graph showed a sharp dip in her O2 seconds later.
- Our Google Sheet log showed the LVAD alarming for low flow at that moment.
Finding the Pattern: Connecting the Dots to the Real Cause
After a few nights of tedious work in our “at-home lab,” logging data and testing apps, a critical pattern began to emerge. Our alarm log in Google Sheets was undeniable: the problem was exclusively nocturnal.
This is where the Flow Insights guide became our roadmap. We had two solid leads from the guide, but the other clue came from our own investigation.
- Clue #1 (The “What”):
The symptoms -low flow alarms, occasional headaches, and elevated BP during the events were a perfect match for the High Afterload (Hypertension) and a few markers from the low preload profile in the guide. This told us what was happening to her body. - Clue #2 (The “When”):
The guide, however, didn’t have a profile for why this was only happening at night. That clue came from our own data: the strictly nocturnal timing of every single significant alarm.
The real breakthrough came when we asked the crucial question: What could cause blood pressure and cardiac afterload to spike dramatically, but only during sleep?
Our research consistently pointed to one primary suspect: Obstructive Sleep Apnea (OSA). We realized that even though our doctors had initially dismissed the possibility, the data was telling a different story.
It was like being a detective: the high afterload was the weapon causing the alarm, but the sleep apnea was the culprit using it. We confirmed our theory by observing that the events only happened when she rolled onto her back. The diagnosis was clear: the alarms were being caused by positional obstructive sleep apnea.
The Positional Proof: A Look at the Data
The final piece of evidence came from a separate log my dad was keeping, where he simply noted her sleep position. While I was focused on the technical data, he was tracking the physical context. When we combined our logs, the correlation was undeniable and statistically significant.
The data below compares the nights where back-sleeping was observed with the nights she remained mostly on her side.
| Metric | Observed Back-Sleeping (“Side and back sleep”) | Side-Sleeping Only (“Side sleep mostly”) |
| Number of Nights Logged | 3 nights | 11 nights |
| Total Alarms Recorded | 24 alarms | 13 alarms |
| Average Alarms per Night | 8.0 | 1.2 |
The statistical conclusion is clear. The log shows a nearly seven-fold decrease in alarm frequency when she remained on her side. Most tellingly, during a 6-day period from August 11th to August 16th where her position was logged as “Side sleep mostly,” there were zero alarms recorded. This data was the definitive proof that her alarms were being caused by her sleep position.
The Science Behind the Alarms: The Clinical Evidence
Our personal investigation pointed directly to positional sleep apnea, and the clinical evidence confirmed it. The core issue is that a continuous-flow LVAD acts as an amplifier for the effects of sleep apnea. Below are the key mechanisms and data clues, backed by clinical research, that explain how this happens.
Reduced Preload
During an apnea, the struggle to breathe creates negative pressure in the chest, impairing blood return to the heart. Since LVADs are preload-dependent, the pump is starved of volume, leading to suction events and low-flow alarms.
Source: Sleep, 1996
Read the Study →Increased Afterload
When you gasp for air after an apnea, your body releases stress hormones, causing a surge in blood pressure. Because LVADs are afterload-sensitive, the pump must work much harder against this resistance, causing flow to drop.
Source: AHA Scientific Statement
View the Statement →Right Ventricular Dysfunction
Low oxygen levels during apnea can increase pressure in the lungs. This strains the right side of the heart, which is responsible for feeding blood to the LVAD in the first place, further compromising the pump’s flow.
Source: AHA Scientific Statement
View the Statement →Clue: The Sawtooth Pattern
A repeating pattern of sharp drops and quick recoveries in your blood oxygen (SpO₂) at night is a classic visual signature of obstructive sleep apnea and a key piece of evidence to look for in your data.
Source: New England Journal of Medicine
Read the Review →An Unexpected Epilogue: The Journey Continues
As of August 22, 2025
Just as we felt we had solved the case, our journey took an unexpected turn – one that many caregivers will find familiar.
When we presented our comprehensive data to the LVAD team, their initial recommendation was not to investigate the sleep apnea, but to adjust the device’s software. The proposal was to lower the low-flow alarm threshold from 2.5 L/min to 2.0 L/min and to keep the Hematocrit setting at an artificially low value. In essence, the proposed fix was to silence the symptom rather than investigate the clear, data-supported cause.
This is a common challenge in patient advocacy, and it has only strengthened our resolve. We are respectfully pushing back on these software-only fixes and insisting on addressing the underlying physiology by having the Hematocrit set to its correct value. To build an even more irrefutable case, our next step is to upgrade our toolkit. We are now moving forward with the EMAY SleepO2 Pro monitor to capture direct airflow data and generate our own detailed sleep report, measuring and troubleshooting with the Apnea-Hypopnea Index (AHI) at home.
This experience is a powerful reminder that our work as data detectives is an ongoing process. Finding the answer is the first step; effectively communicating it and advocating for the right course of action is the next, and often harder, battle. The journey to “find your flow” is continuous, and we will post updates as we gather more evidence.
Stay vigilant, trust your data, and never stop advocating.
Important Disclaimer: Please remember, this article chronicles our personal experience and is for informational purposes only. The information here is not a substitute for professional medical advice. Always consult with your VAD coordinator and medical team before making any changes to your care plan.

